Modify Data Table
This page is currently under review. Stay tuned!
Last updated
Was this helpful?
This page is currently under review. Stay tuned!
Last updated
Was this helpful?
During the topic configuration phase there is the possibility to modify the data table by adding static filters or a sort, in order to get more precise insights out of your data.
These are optional functions, but they can be very useful to narrow down your results and analyze your data according to given parameters.
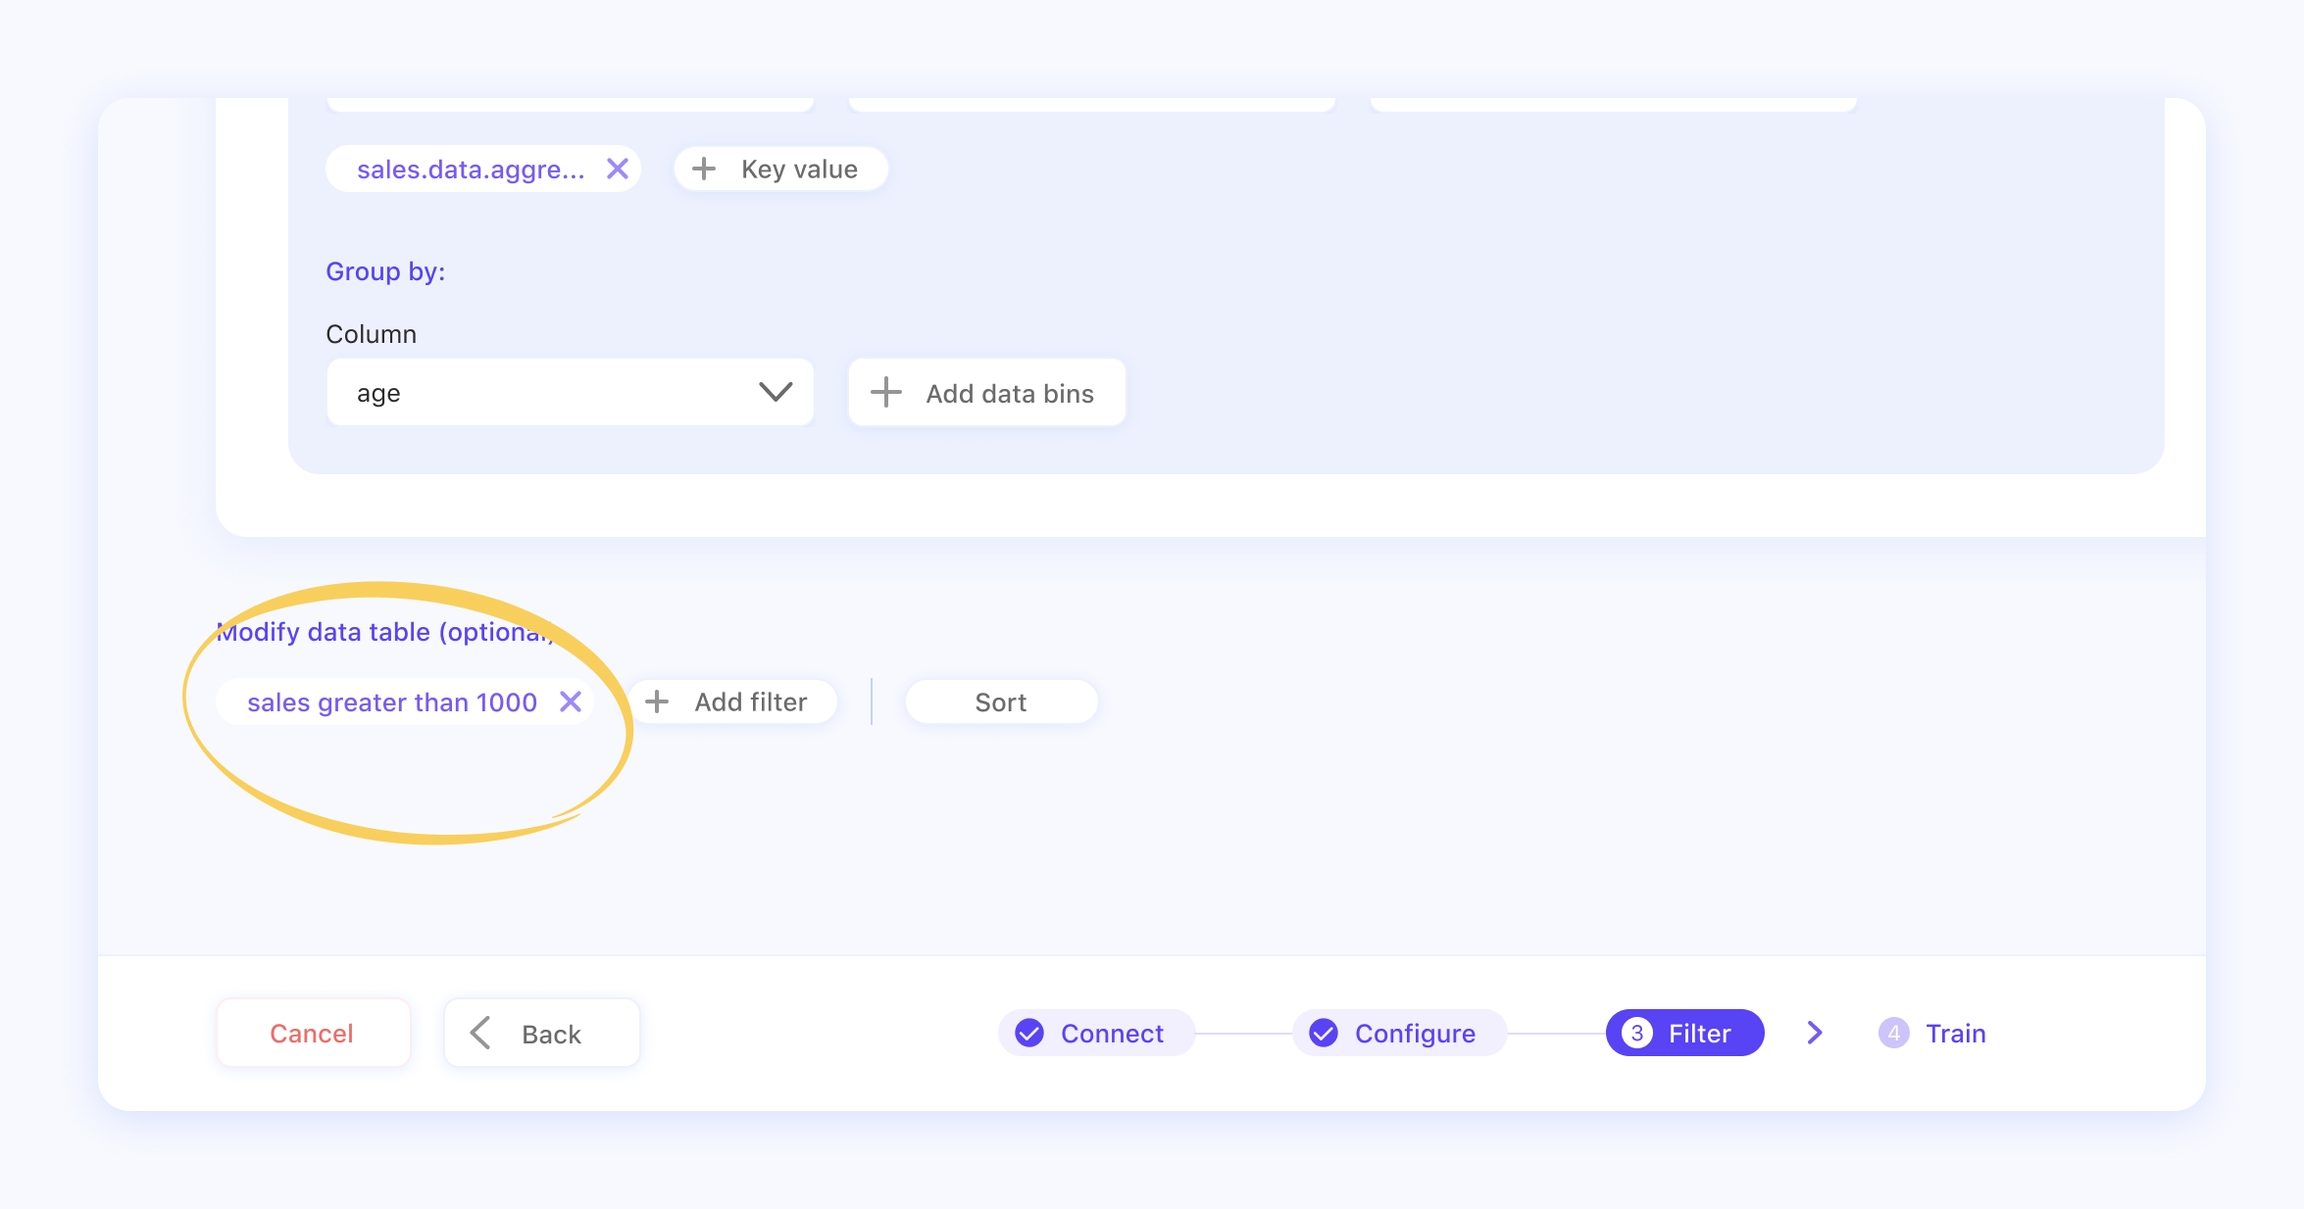
Filters can help to refine the insights by setting parameters for the retrieved data.
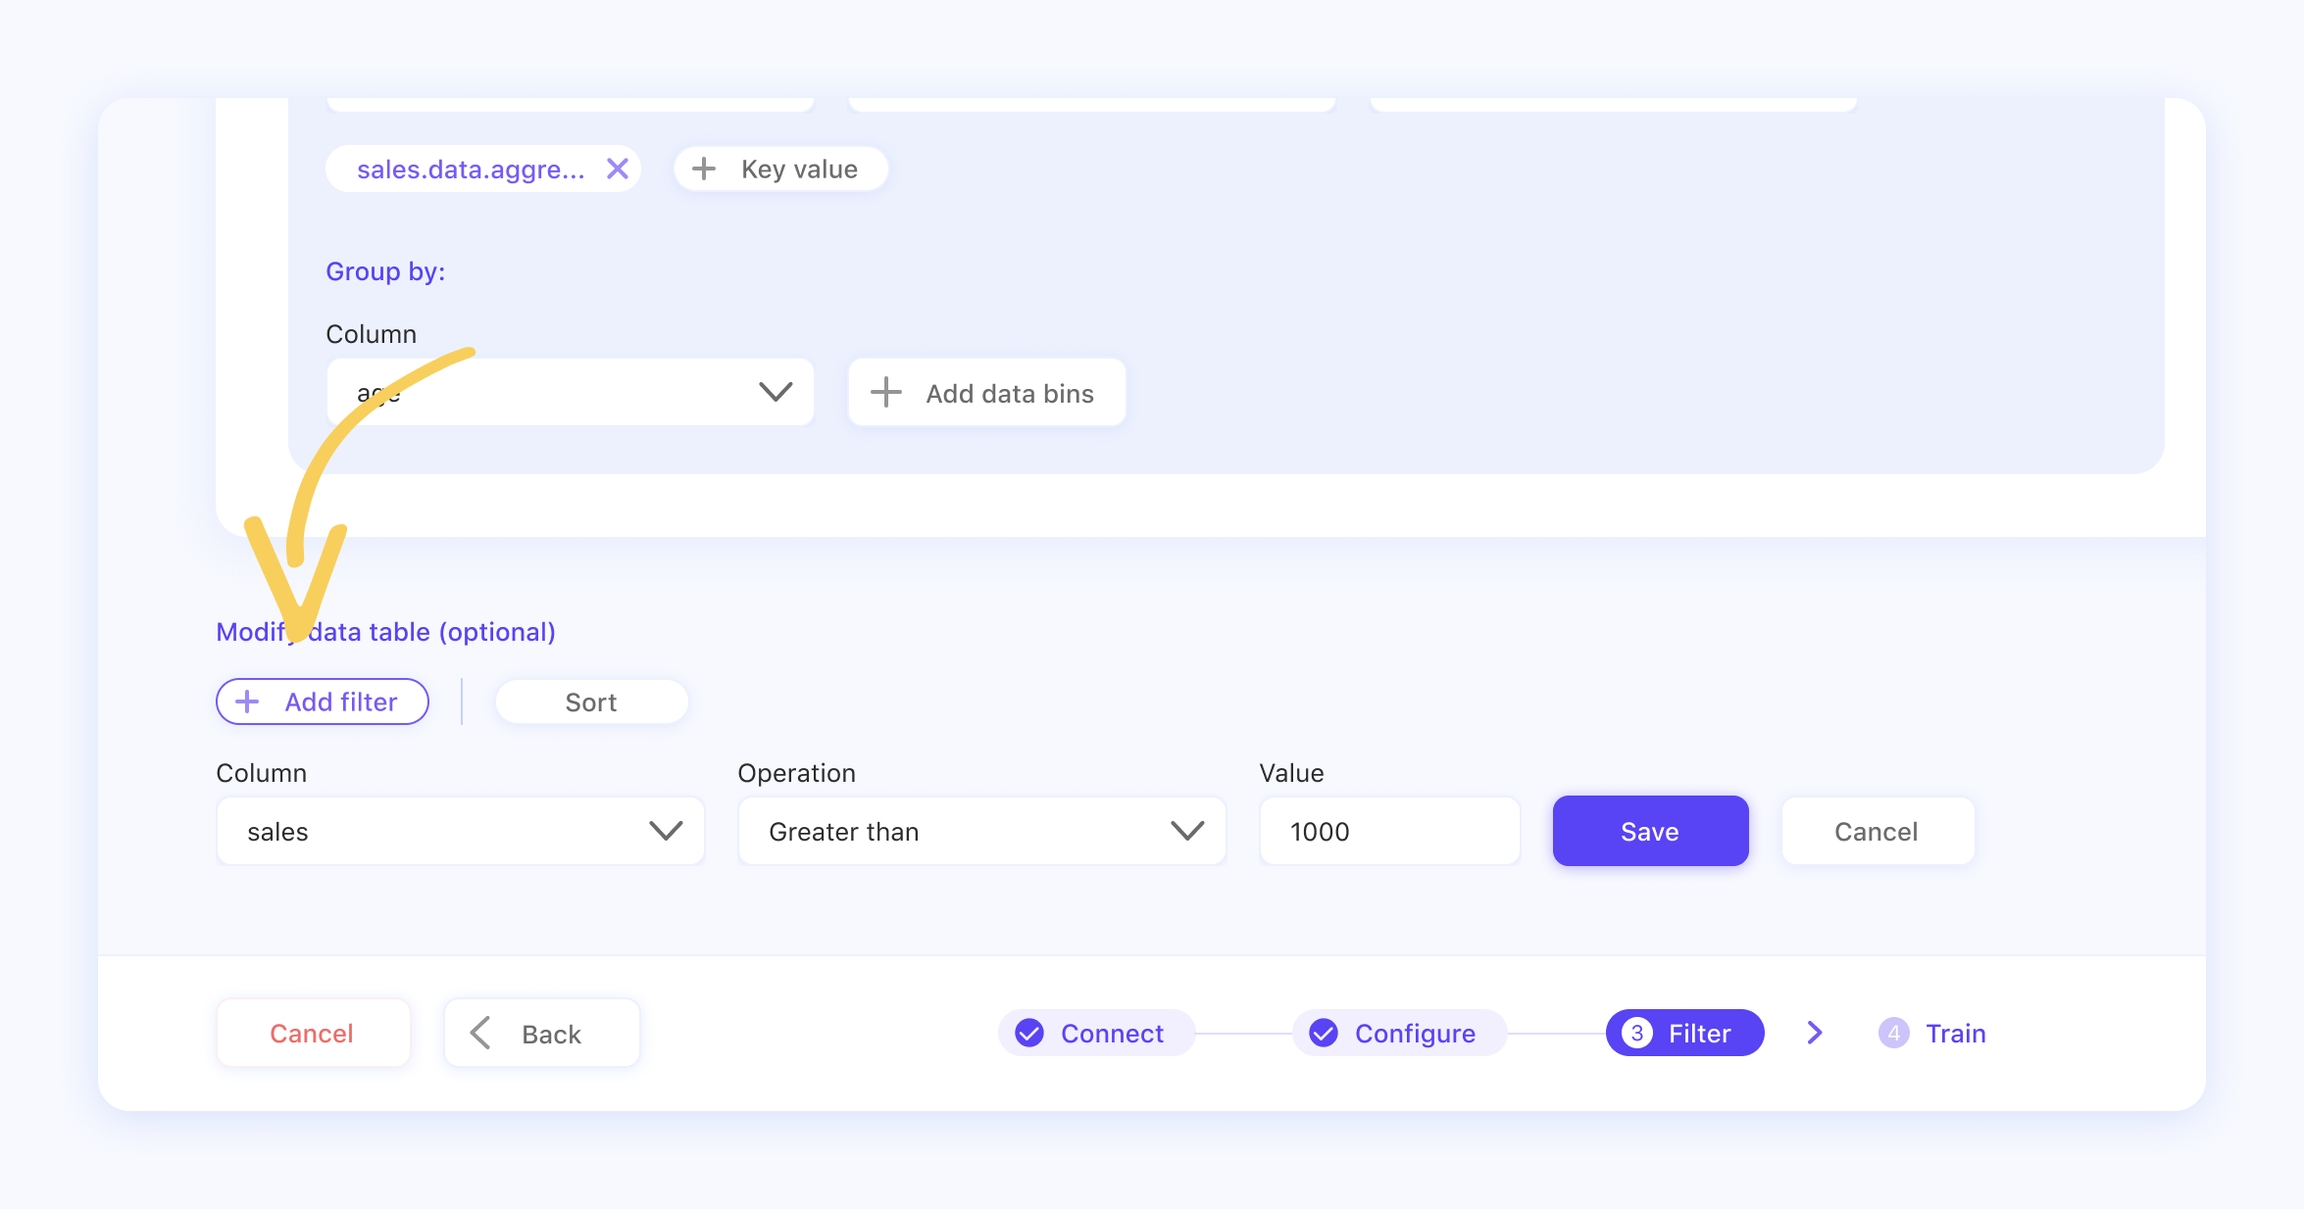
For example, you might like to exclude all data that is below zero. The filters applied to the data table are static, meaning that they will always be applied by default to the topic. Not to be confused with the dynamic filters that are found in the next step, where you can choose what filters values to apply to your topic in the conversation. Once you select the filter data option, you will have to indicate the column and the operation you want to execute.
The types of operations supported are:
Equal to
Different than
Greater than
Less than
Greater than and equal to
Less than and equal to
Between
Empty
Not empty
Is
Is not
Contains
Not contains
Starts with
Ends with
You can add multiple filters. In order to check the effect the filters had on your topics data table, you can always click on the Preview data button in the top right corner of the view.
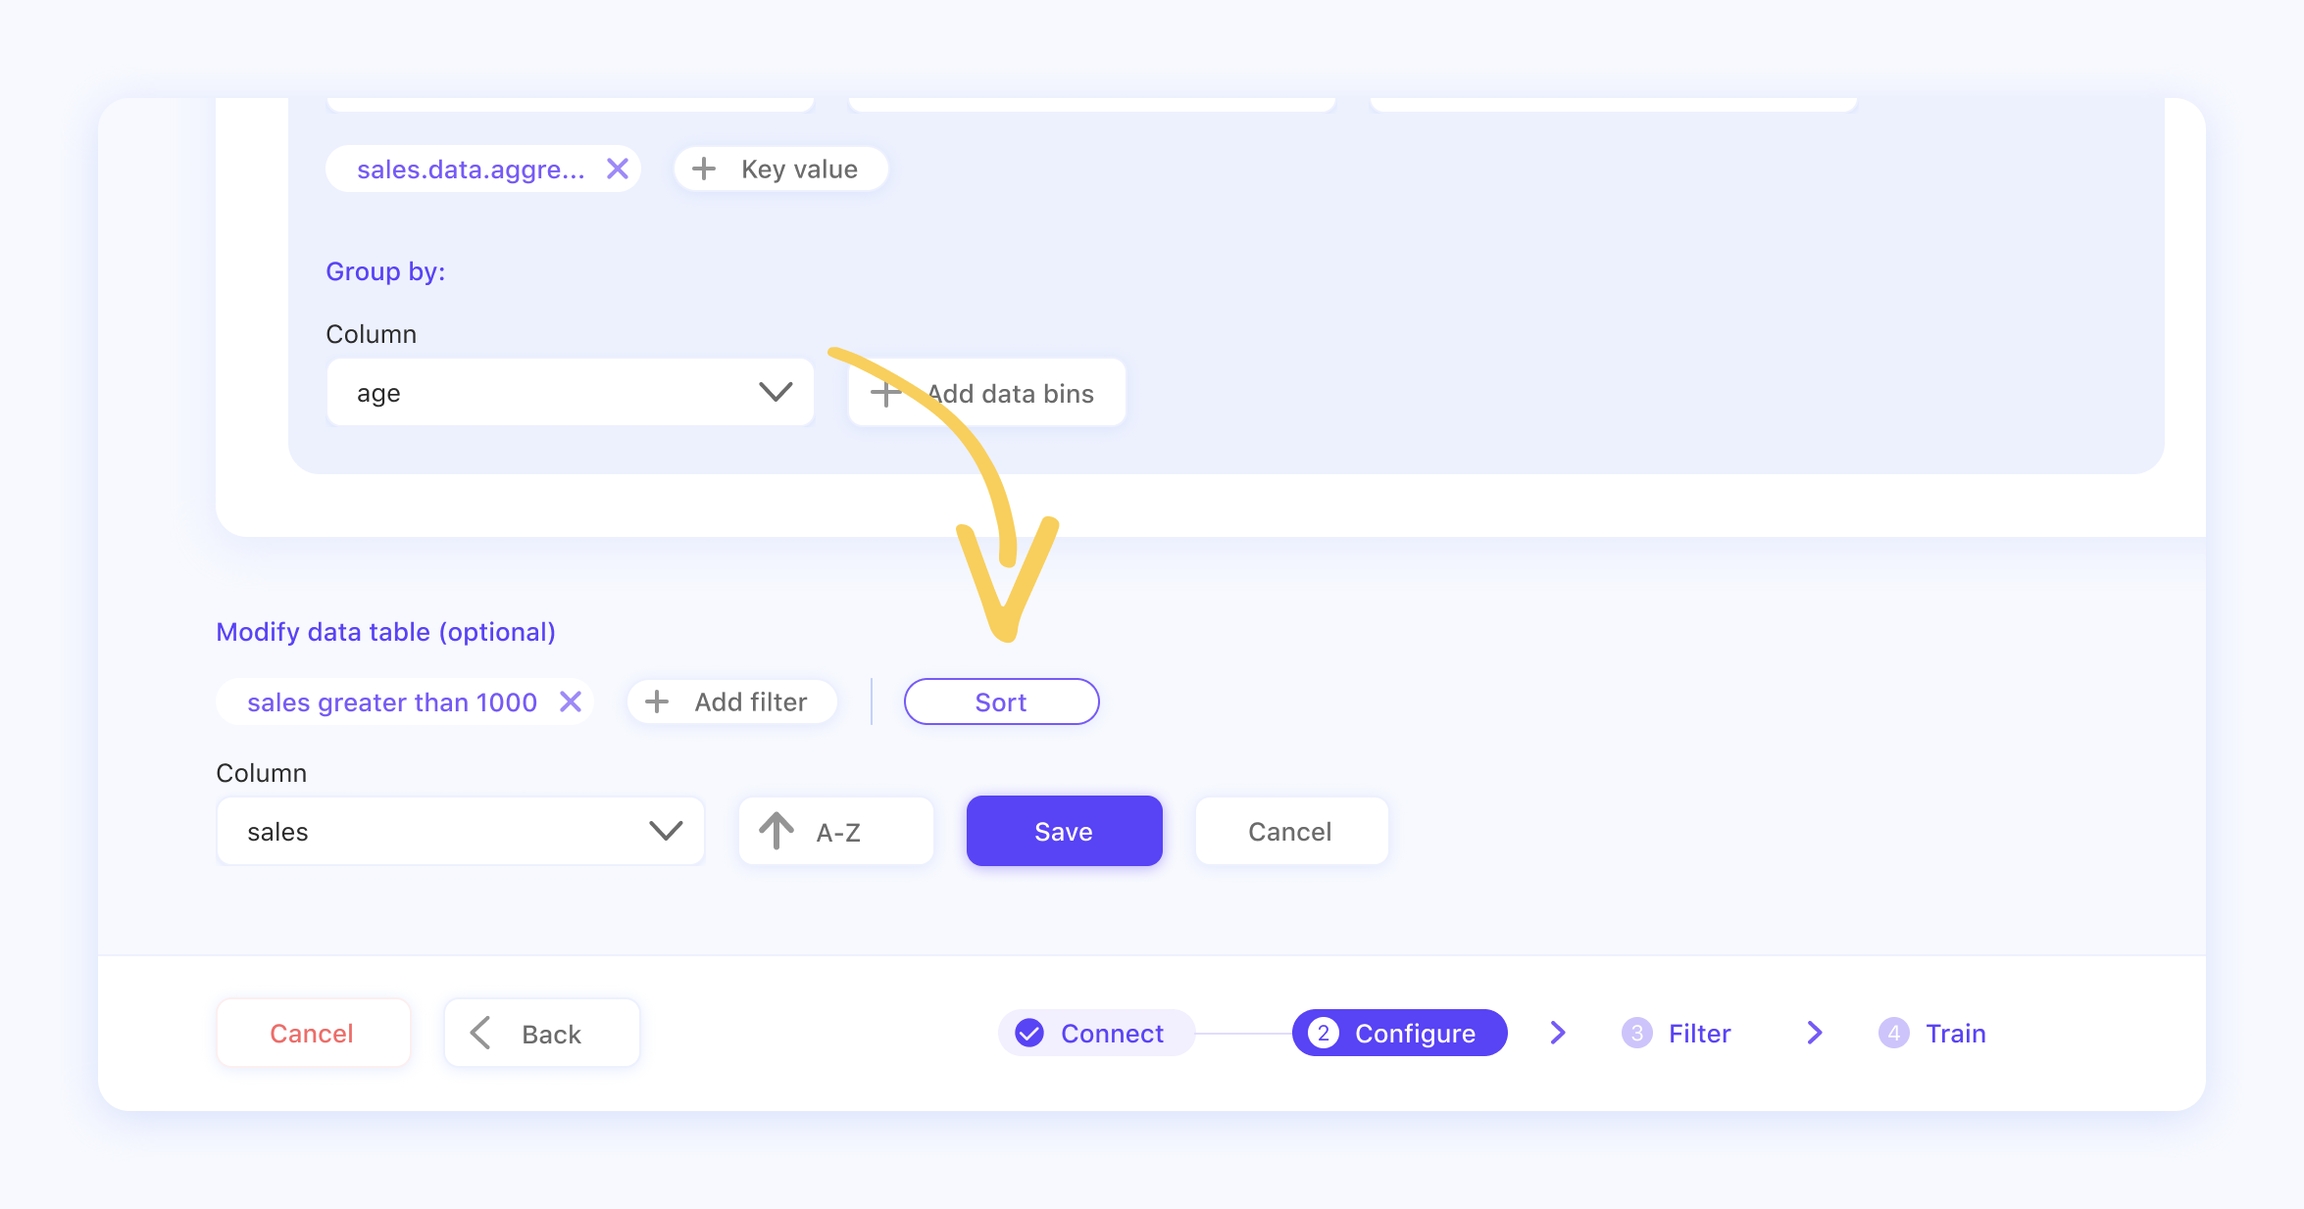
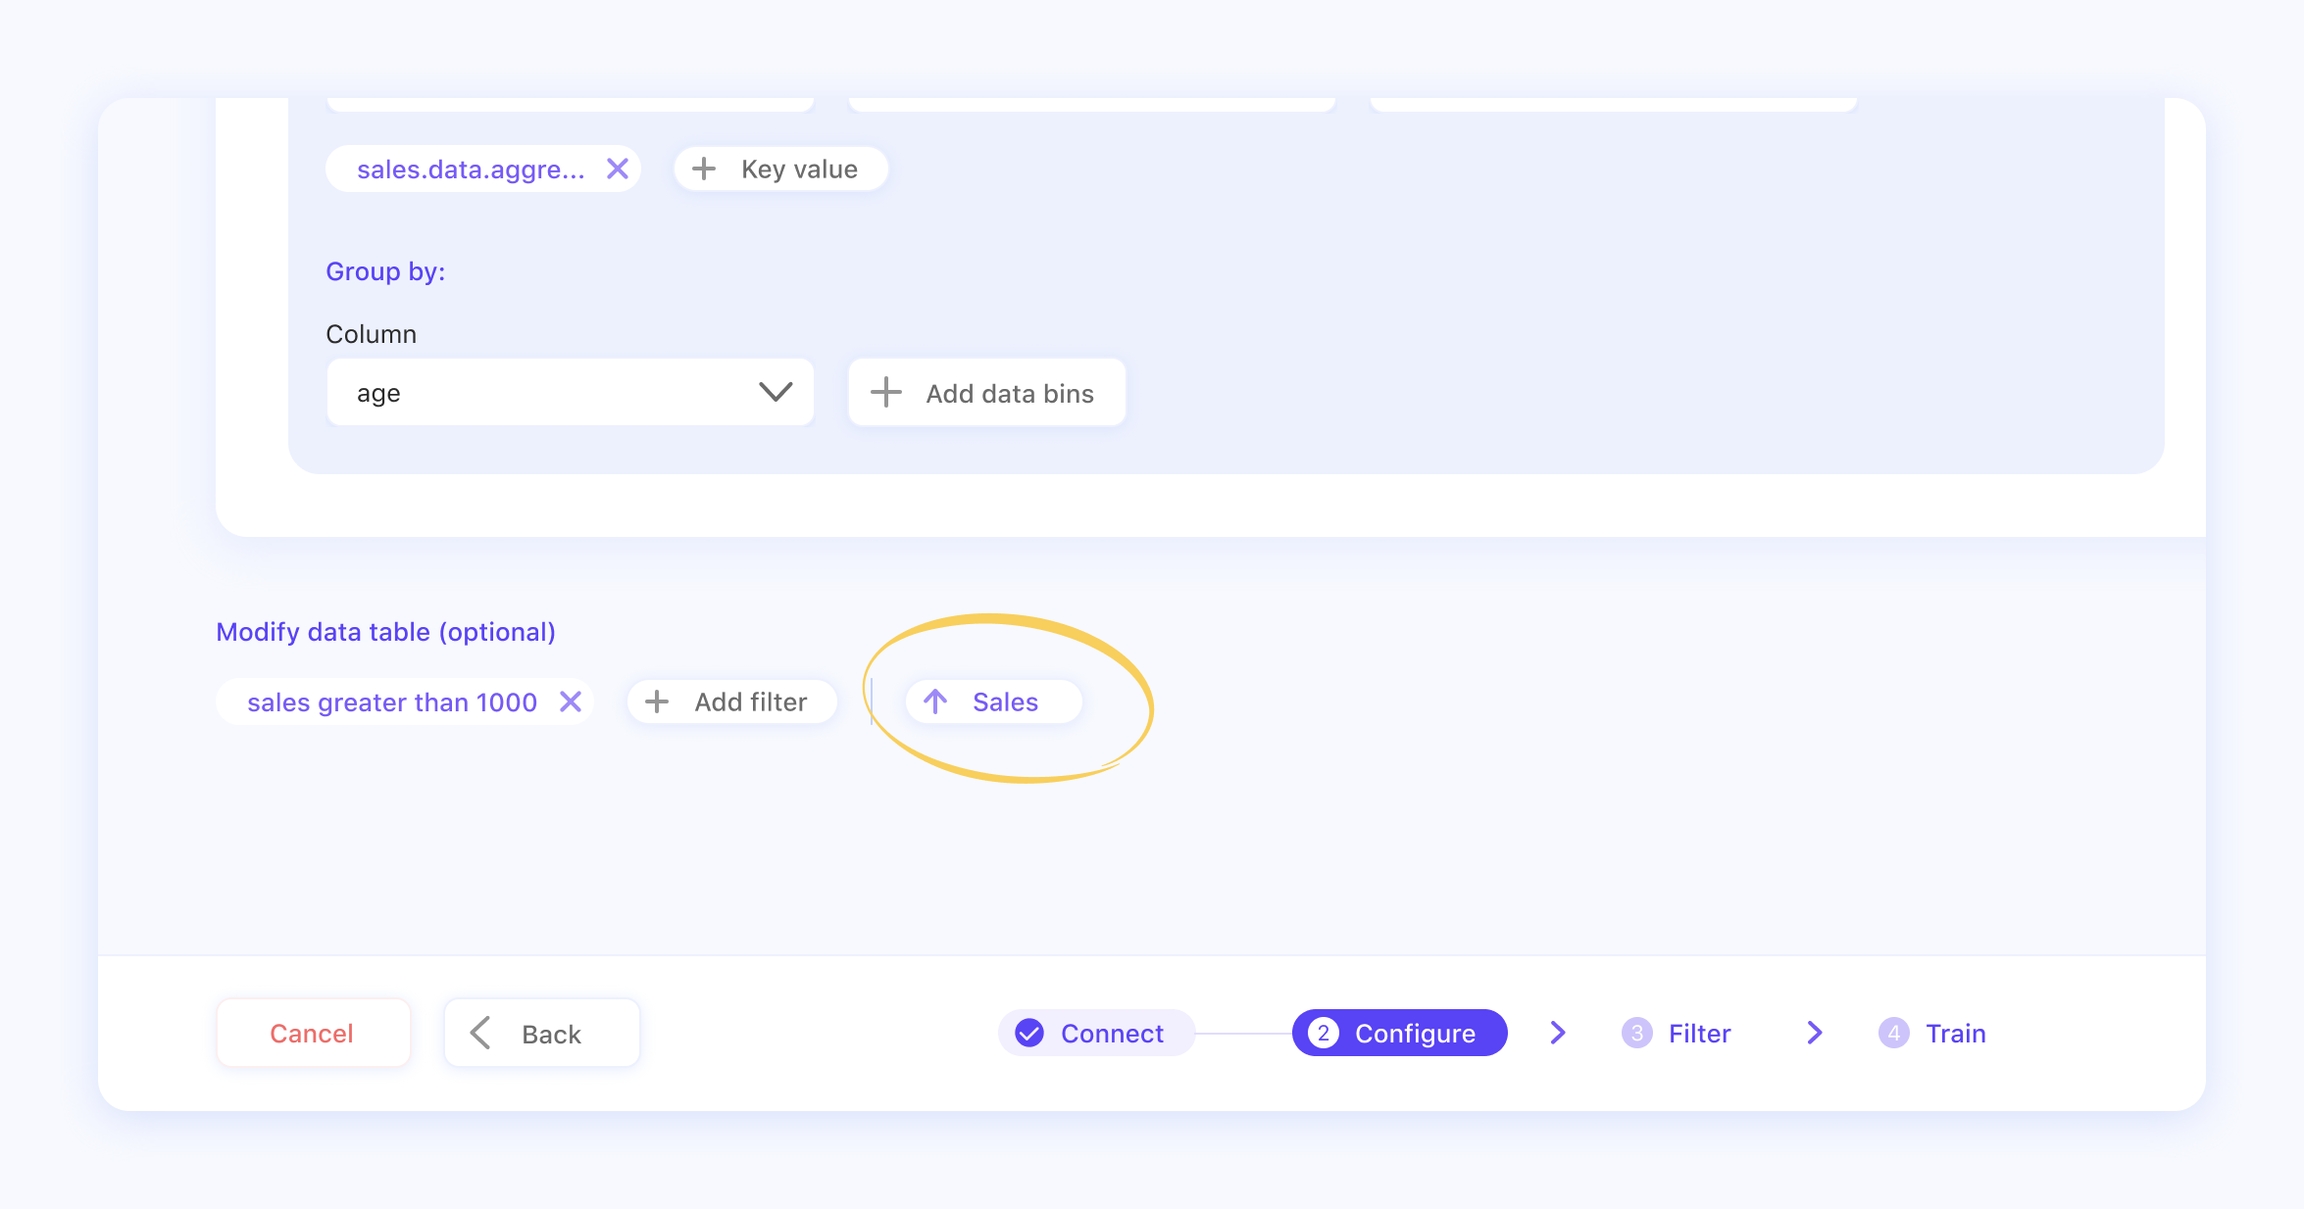
The sort function gives the user the capability of sorting the dataset along some dimension. For example, given that the column Age is present, a user may want to sort the data according to ascending or descending order.
For some visualizations the sort option is not available. For instance, for a single line chart where the time series is considered on the x-axis, no sorting should be allowed since the data is presented in chronological order. Thus, timestamps cannot be sorted since they are already in the correct sequence.
Sorting is an option for the following visualizations:
Single column
Single column pos neg
Cluster column
Stacked column
Scatter plot
Gauge chart
Table.
You will have to choose the column to sort and the type of sorting (e.g. ascending or descending). It is possible to apply a sort to only one column.
Remember that for some objectives (list and ranking) the sort function is set by default, but you change the order (for example AZ to ZA).
Do you want to know more about the single visualization types and the many opportunities that you have for getting insights from your data?
Check out How to build a ranking table and How to build a list table!


